

APOLLO MICRO SYSTEMS LTD
Technical Analysis

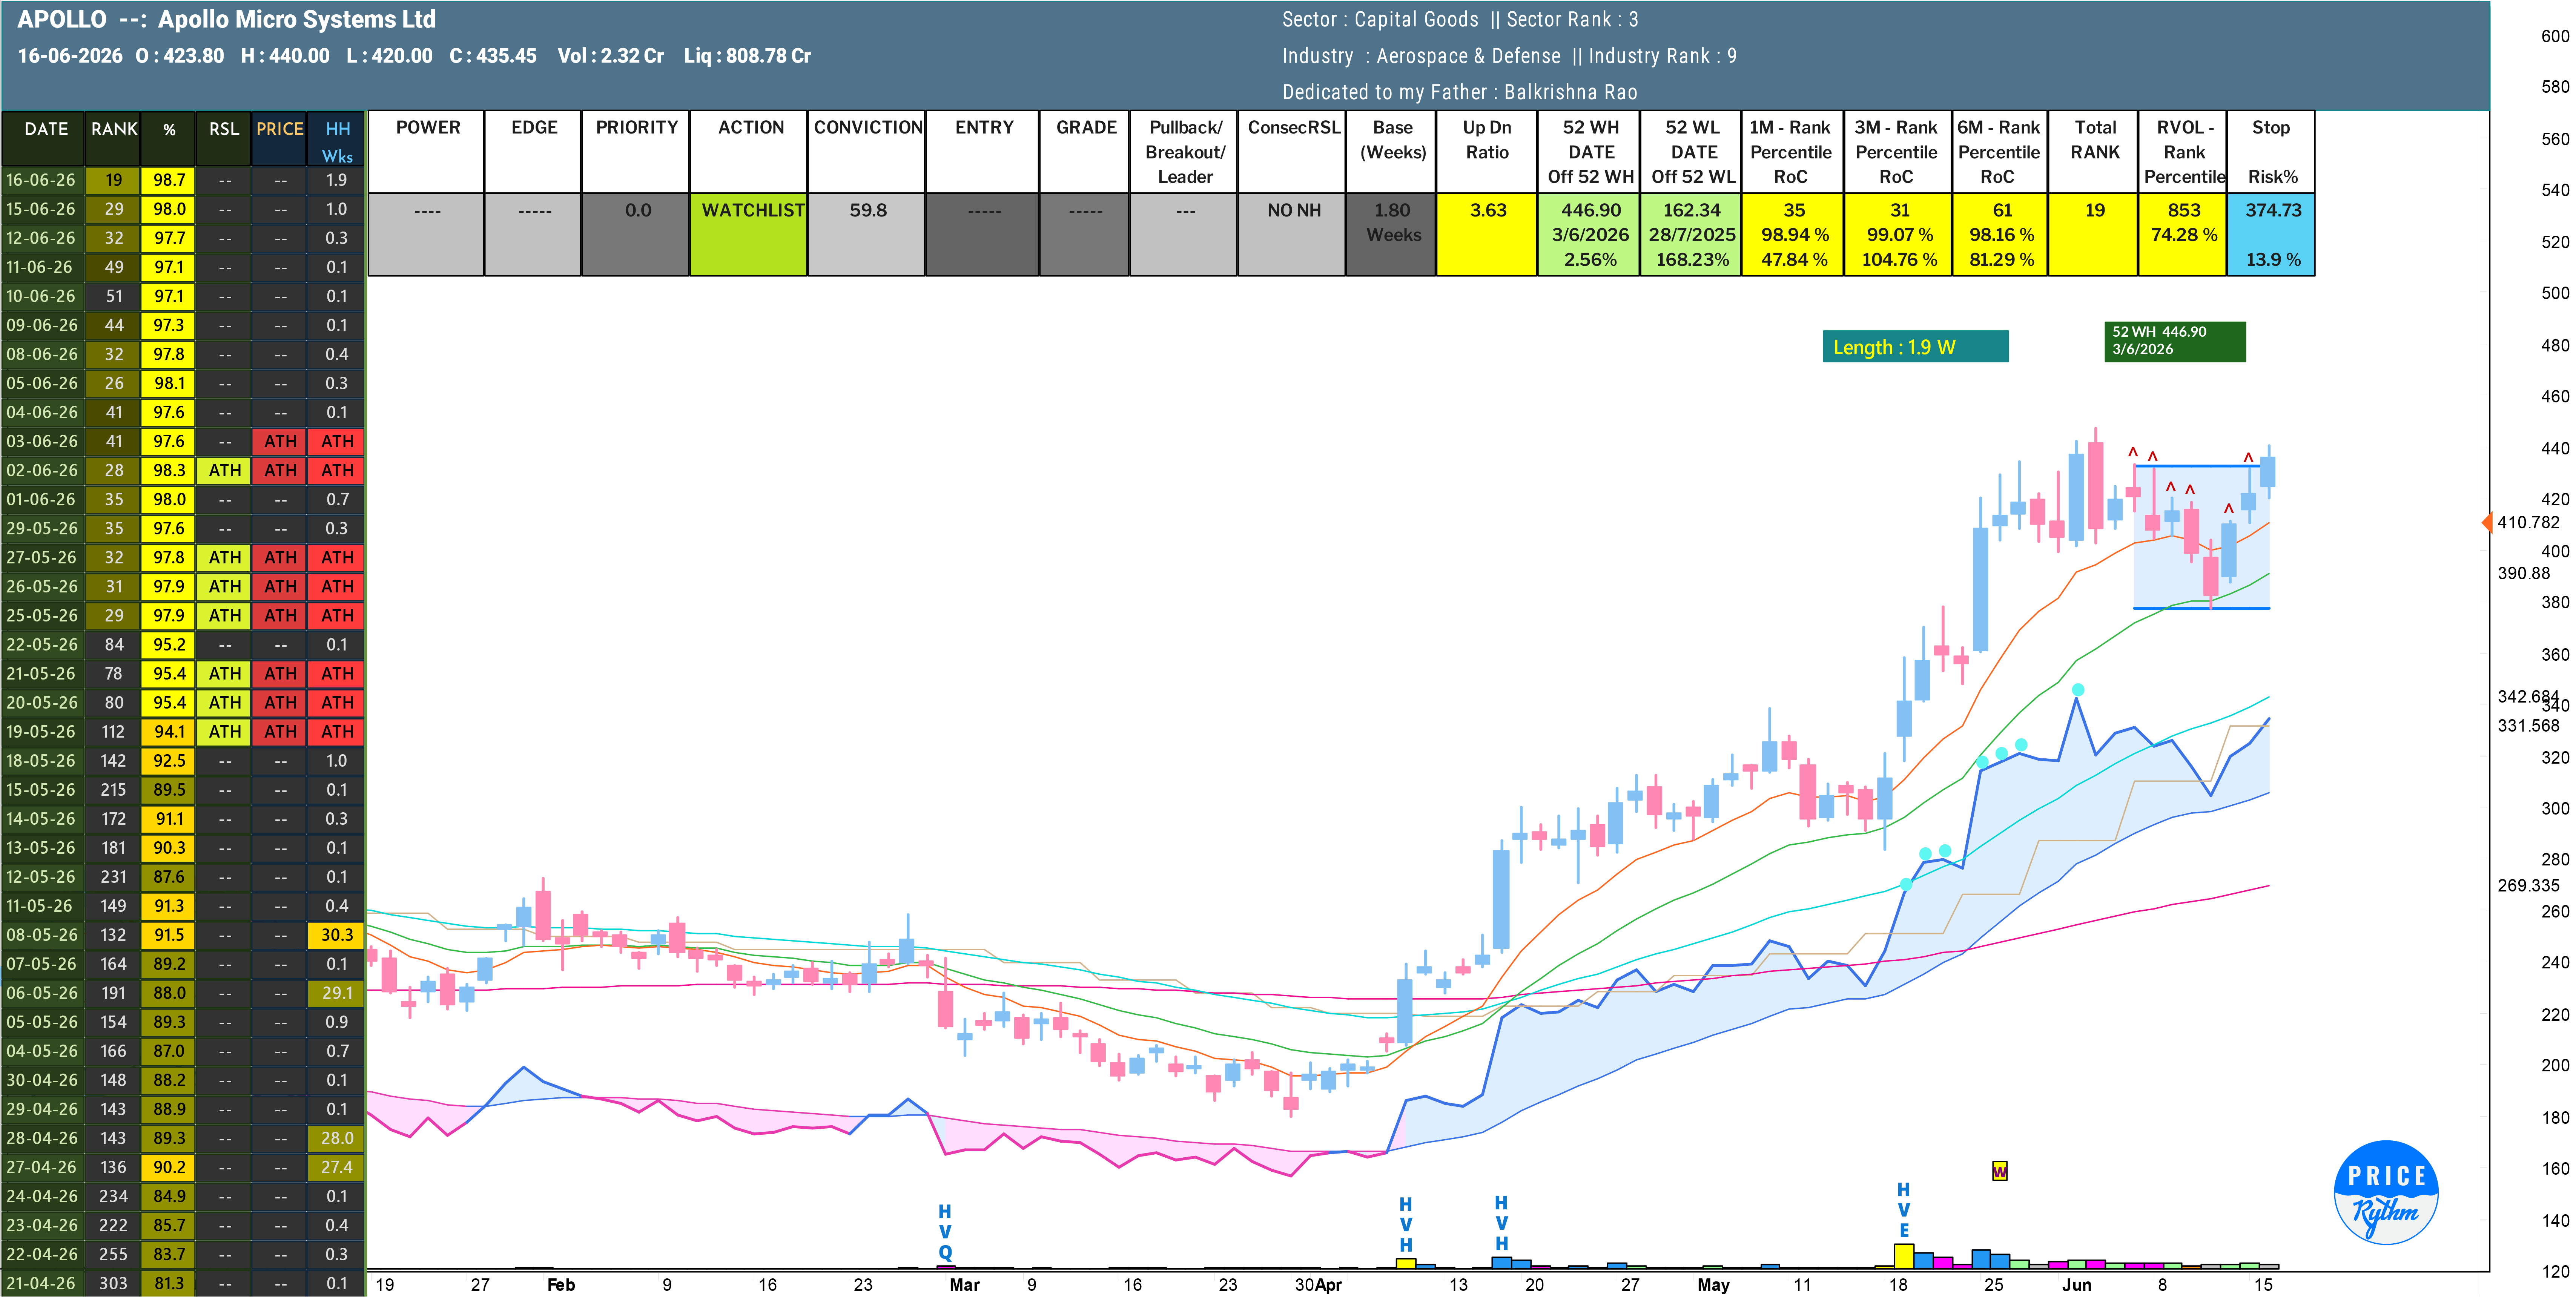
What changed?
The stock did not just recover in price.
It recovered in relative strength and ranking from June 11.
The biggest positive
Rank = 19
This is the first time since the correction started that APOLLO has re-entered true leader territory.
Earlier worry was because:
Rank deteriorated to 45-50.
Price was losing momentum.
Now:
Rank = 19
RSL = 98.7
Up/Down Volume = 3.63
Industry Rank = 9
Those are leader characteristics again.
Look at the blue box drawn.
Price has:
Undercut the base.
Recovered immediately.
Returned to the upper half of the structure.
That’s classic shakeout behavior.
Weak stocks stay near the lows.
Strong stocks return toward the highs.
While APOLLO spent nearly two weeks going nowhere:
Rank improved from 49 → 19
RSL improved from 97.1 → 98.7
That means the stock is outperforming most of the market even without making a new high yet.
That’s usually constructive.
Updated Probability Assessment
Breakout above 447 in coming days/weeks: 70%
Continue building base between 390-447: 25%
Meaningful correction below 380: 5%
Current verdict
APOLLO has gone from “leader under pressure” to “leader rebuilding strength.”
The most bullish thing on the chart is not the rebound from 383.
It’s that the Rank, RSL, and relative performance all improved while the stock was still consolidating below its old high. That’s often what precedes another attempt at a breakout rather than a deeper correction.