


Backtesting Trading Systems in Amibroker
Back testing Ideas

Trading without a system / strategy is equivalent to gambling.
But having a system in place will not suffice the purpose.
The system needs to be reliable and time tested and here is where Amibroker Back testing plays the most crucial role of testing the system on a historical data and then providing the vital statistical data of the performance of such systems.
But before Backtesting one should have a well defined system in place.
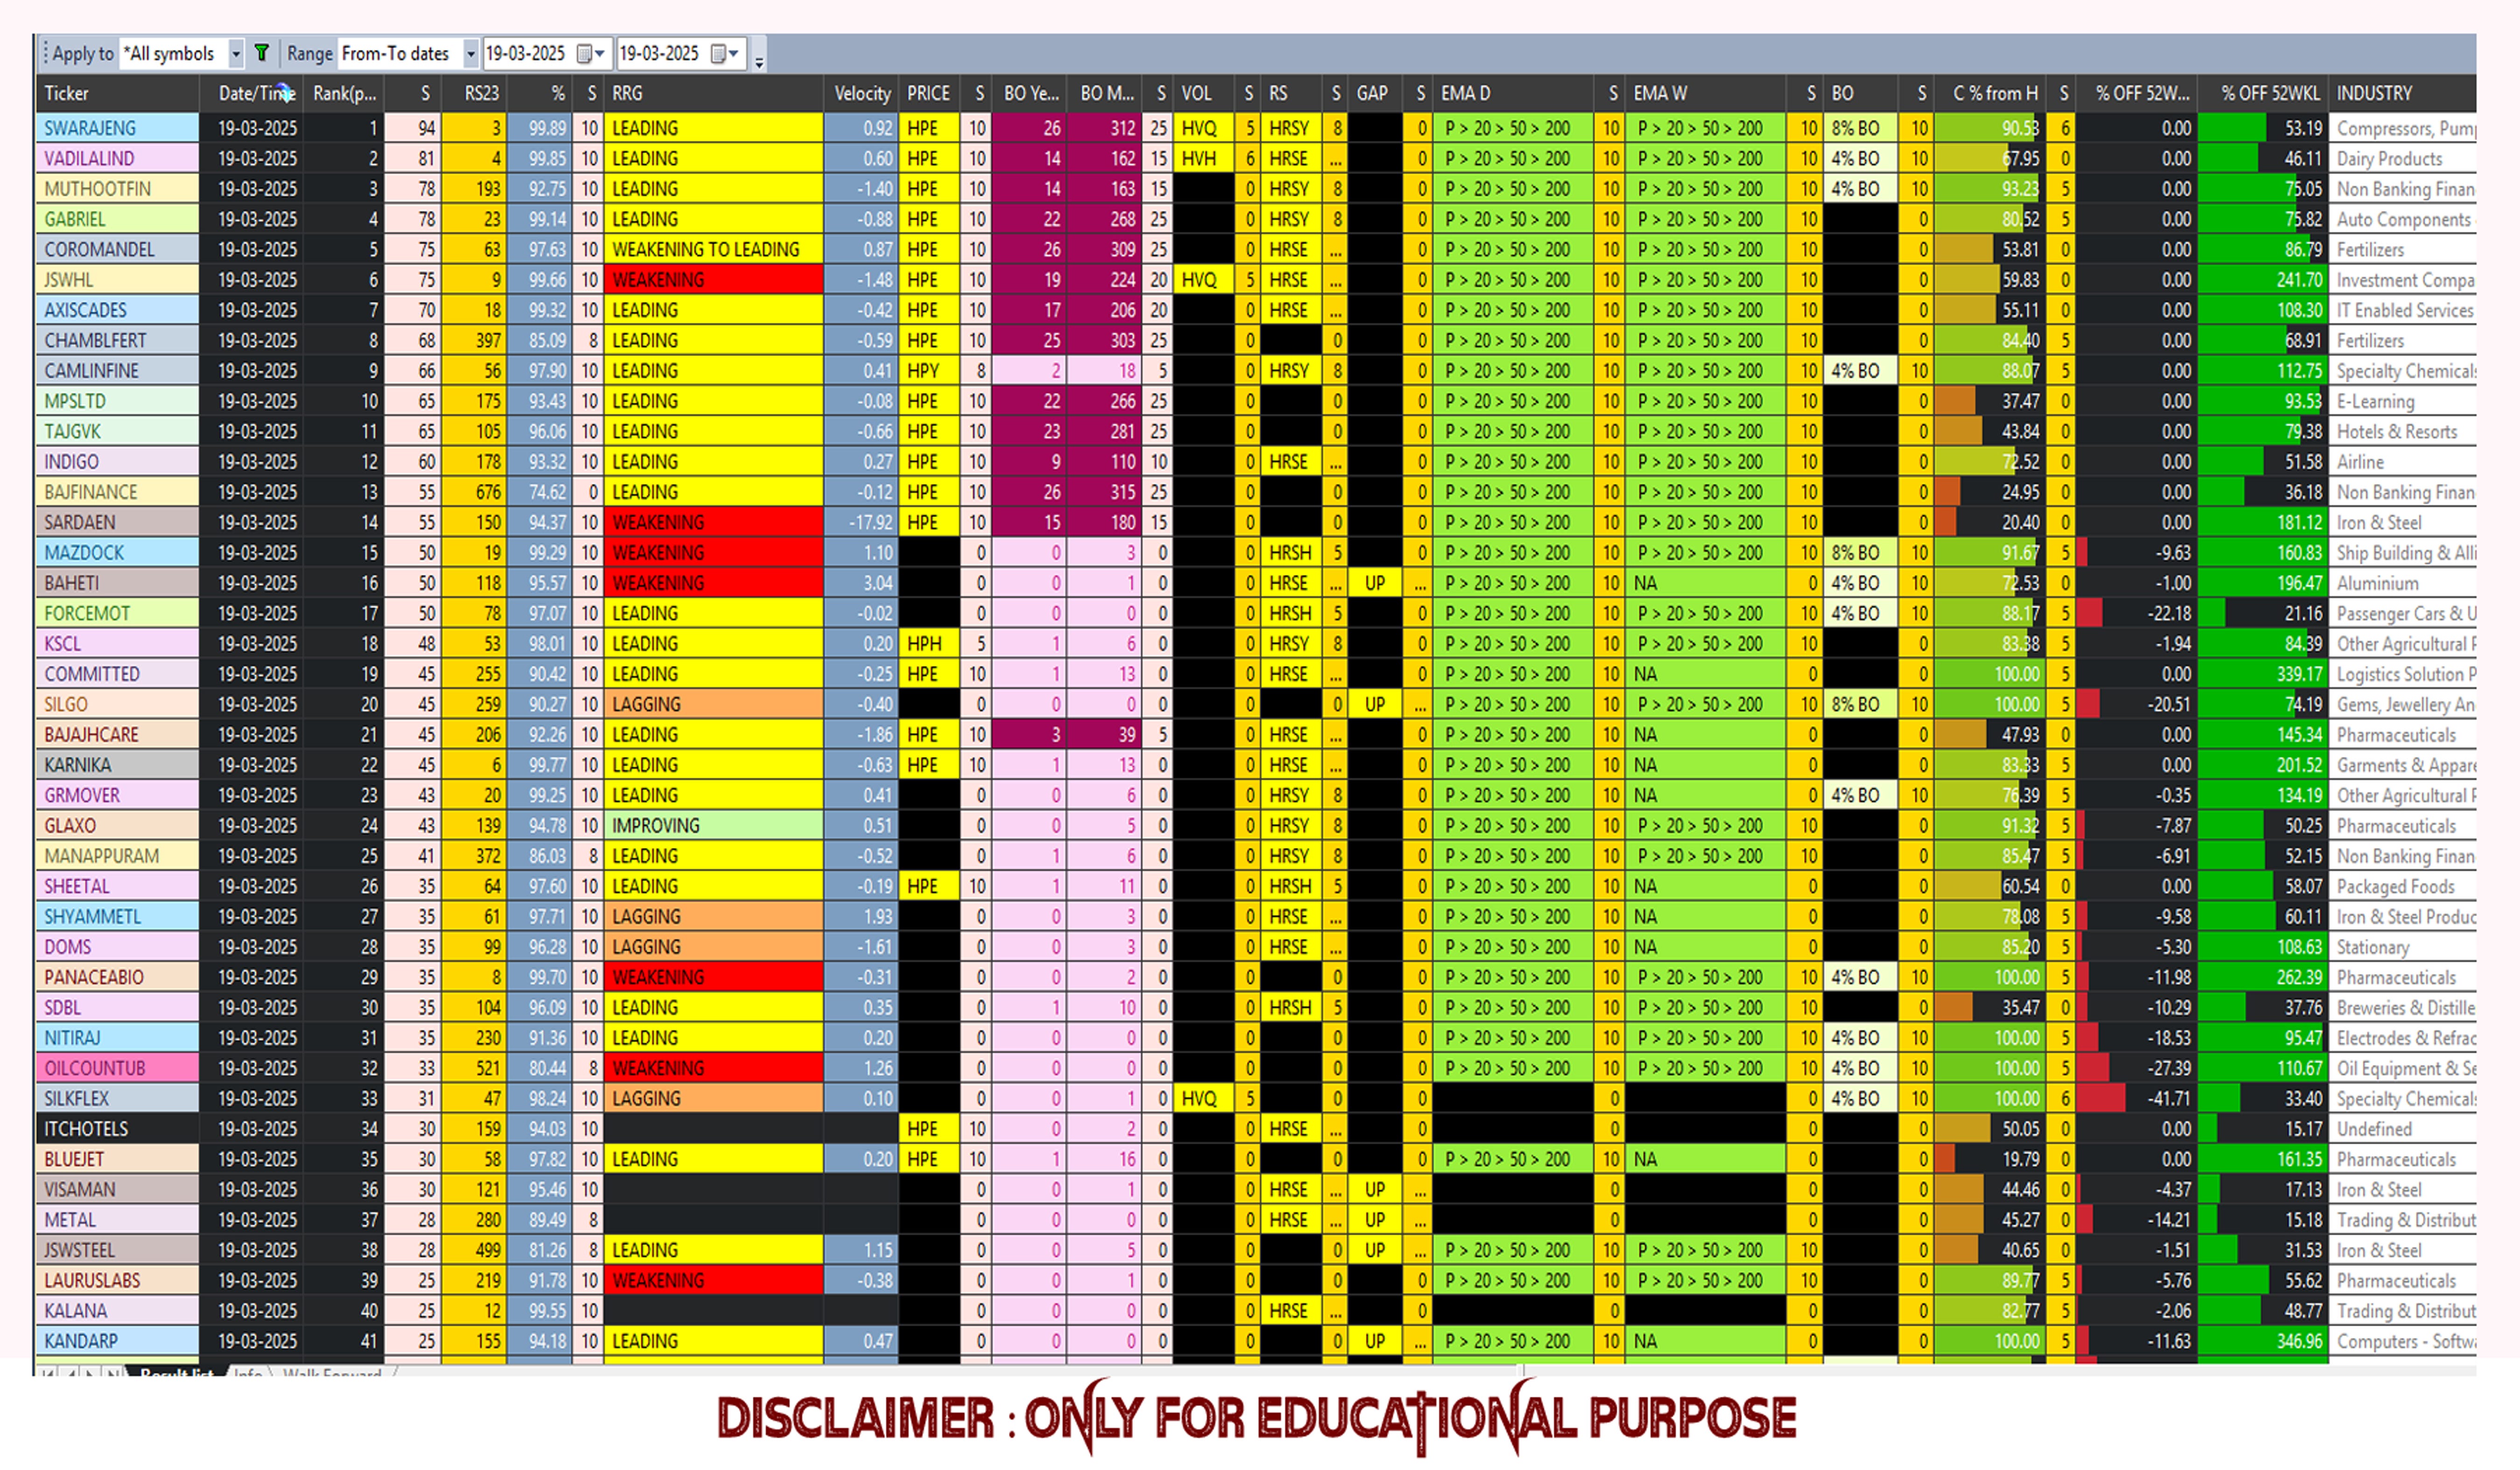
Lets define a system based on Price Action Volume.
1. Momentum Ranking of a Stock
2. Relative Strength Momentum vs Relative Strength Ratio'
3. Velocity - Calculated by dividing vector of RSM by RSR
4. Price - HPE, HPY, HPQ
5. Breakout Periods Price
6. Volumes - HVE, HVY, HVQ
7. Relative Strength Line - HRSE, HRSY, HRSQ
8. Gaps
9. Alignment of EMS's on Daily TF
10. Alignment of EMS's on Weekly TF
11. Daily BO %
12. Closing % from High

Respective Scores shall be given to these 12 Parameters based on the outputs.

Max score for each parameter shall be 10 hence the score percentage would be

SCOREPERCT = SafeDivide(120, ActualScores,0 );
While writing the code for getting Momentum Ranking some filters have been used
if( SelectedValue(C) >6 AND SelectedValue(V) > 1000 AND NOT (SelectedValue(GapUp()) AND SelectedValue(Ref(GapUp(),-1)) AND SelectedValue(Ref(GapUp(),-2)) AND SelectedValue(Ref(GapUp(),-3)) AND SelectedValue(Ref(GapUp(),-4)) AND SelectedValue(Ref(GapUp(),-5)) )) This basically discards stocks less than Rs. 6 and Volumes less than 1000 and stocks in continuous upper circuits.
So to backtest the strategy we will define the Trading Rules - when to enter and when to exit.
So we Enter for the top ranked stocks and exit when MA 50 crossed down MA20.
Enter =  SCOREPERCT < 3  AND SCOREPERCT > ;

Exit =   Cross(MA50,MA20)  ;
So our Buy and Sell Statement becomes
Buy = Enter  ;

Sell = Enter ;
To remove excessive signals
Buy = ExRem(Buy,Sell);

Sell = ExRem(Sell,Buy);
Now we apply a trailing stoploss
HaClose = ( O+H+L+C ) / 4;

HaOpen = AMA( Ref(HaClose, -1), 0.5);

stopTrailHighLine=HighestSince( Buy, High );

stopTrailLowLine=Ref(HaOpen,-1);

trailAmountLong=((stopTrailHighLine-stopTrailLowLine)/stopTrailHighLine)*100;

ApplyStop( stopTypeTrailing, stopModePercent, trailAmountLong,1, True, 0, 0, -1, 1 );
Setting up the position size
EquityBal = 100000;
SetOption( "initialequity",EquityBal);
MaxPos = 5;
SetOption( "maxopenpositions", MaxPos );
SetPositionSize((100/MaxPos),spsPercentOfEquity);
Setting up position score
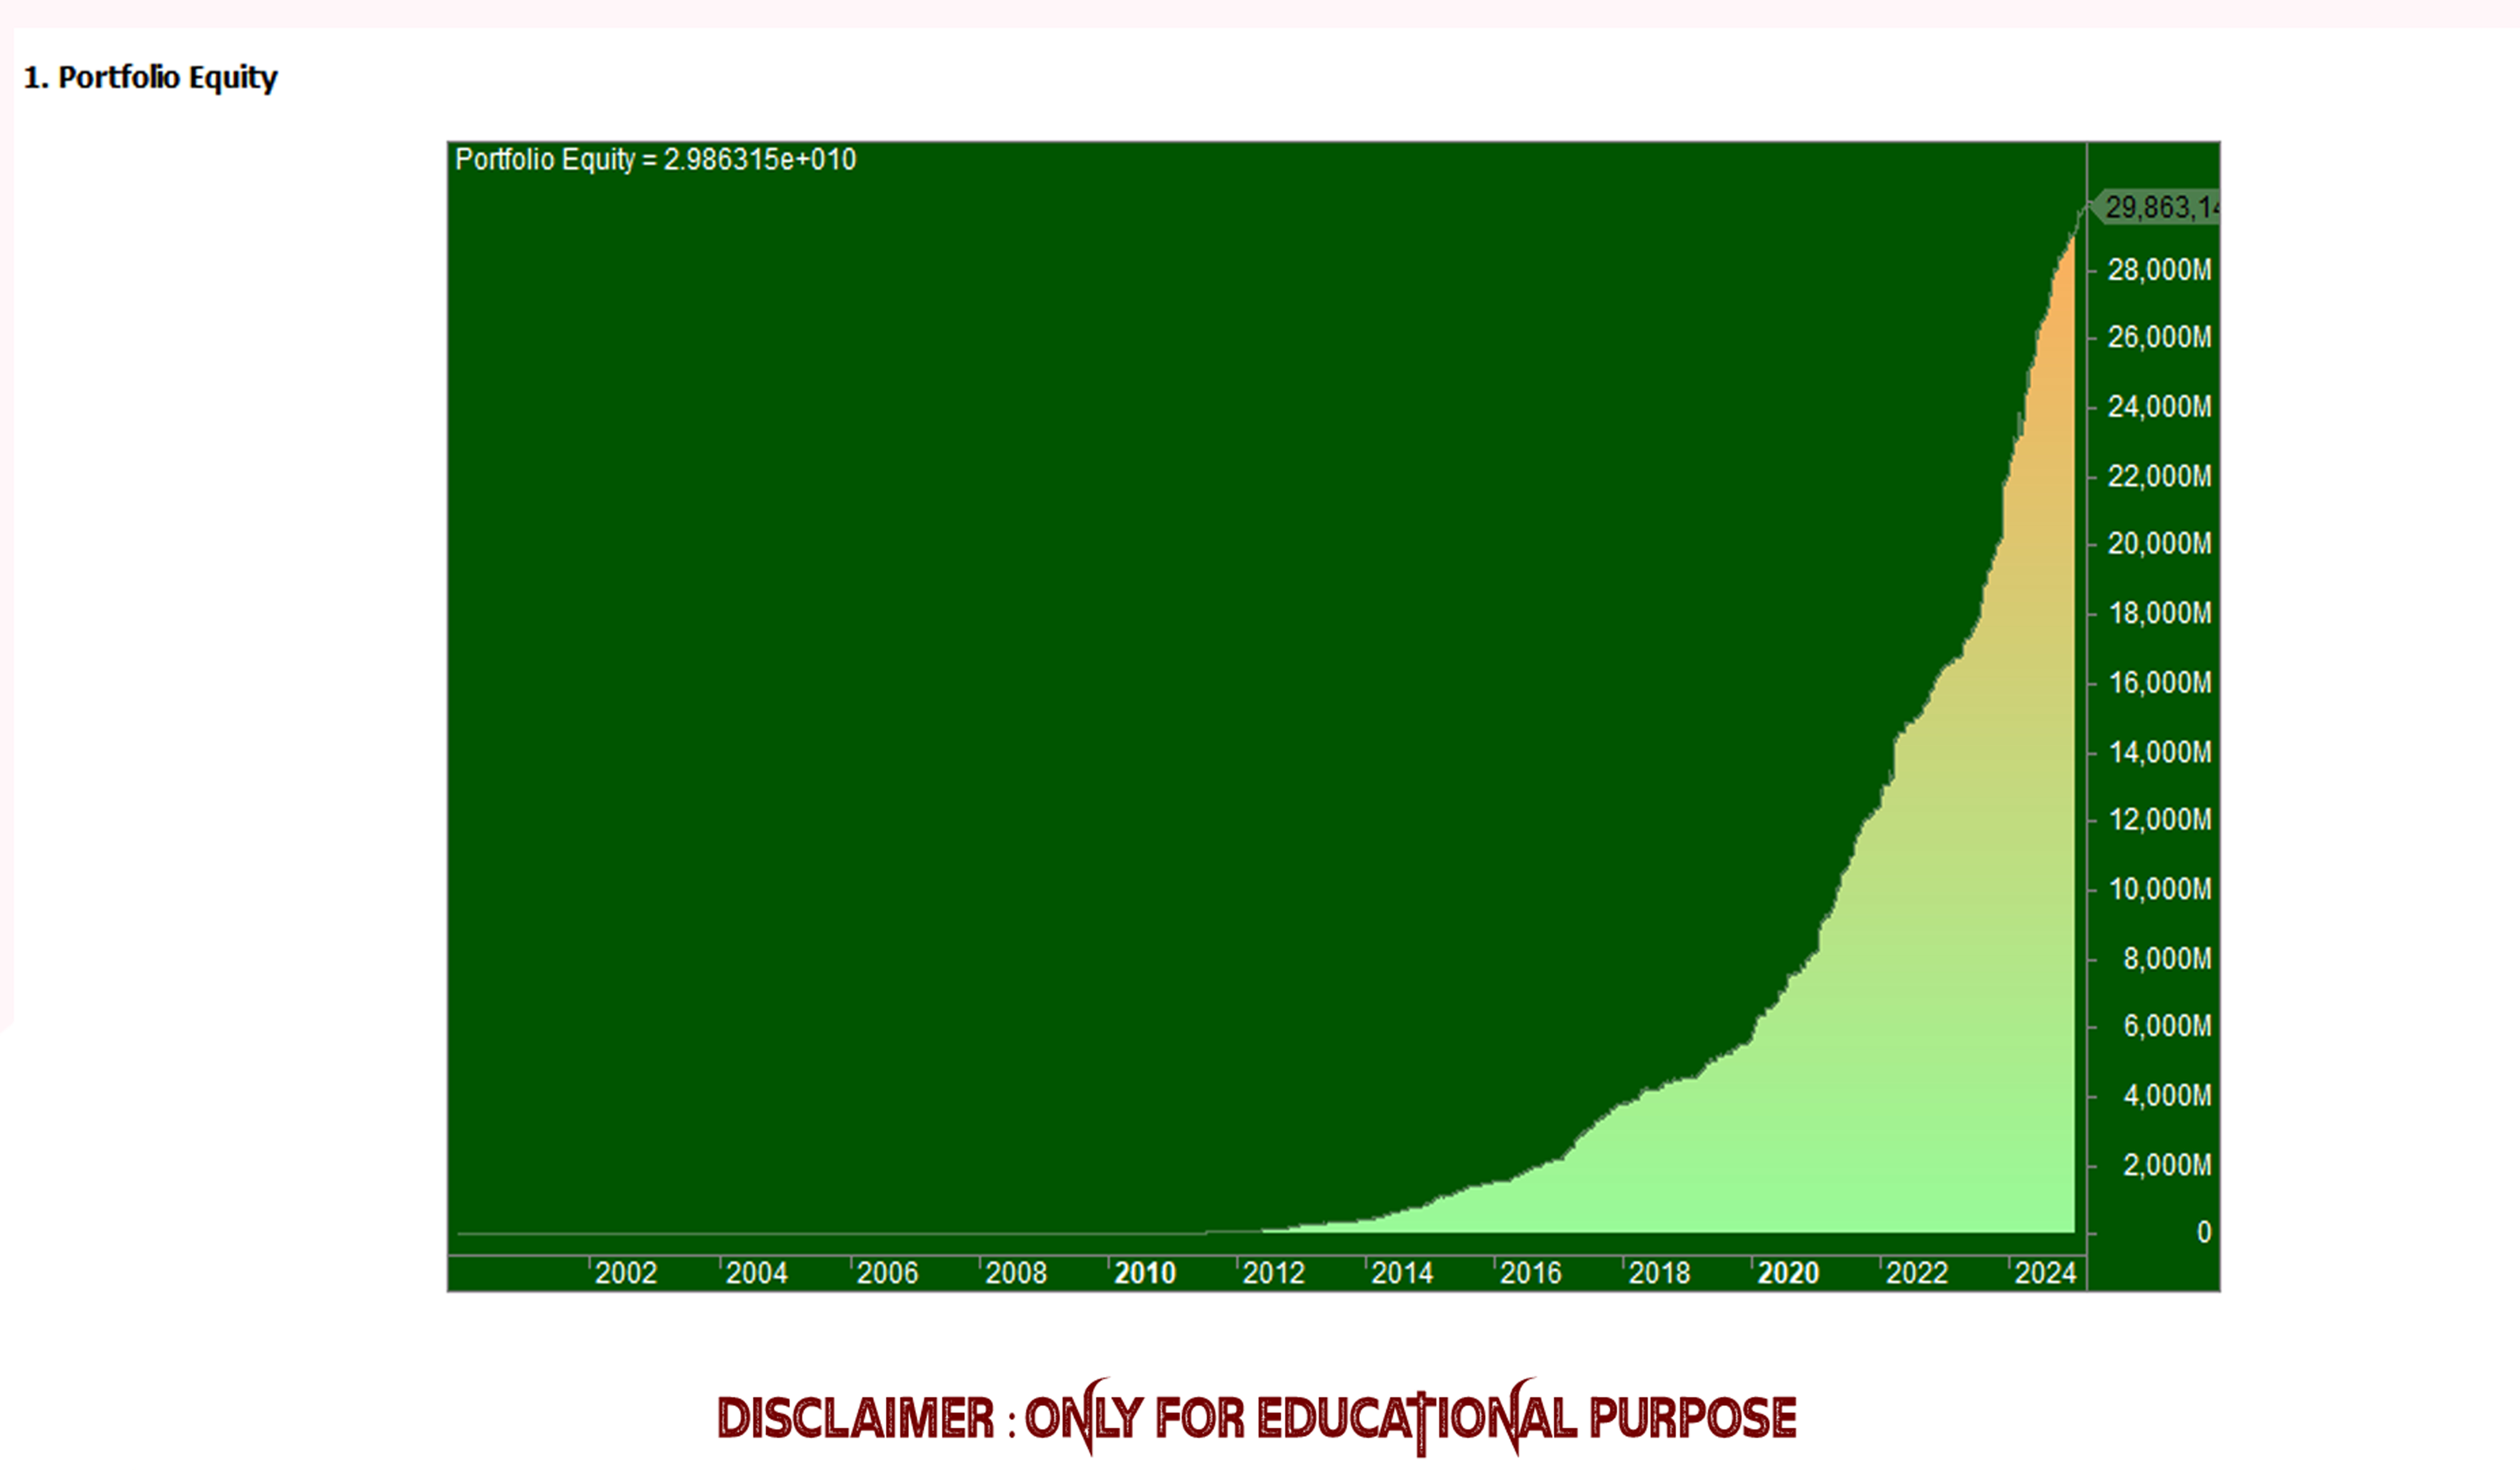
PositionScore = 100- SCOREPERCT ;And we are done with the code for Back testing our strategy. The Report is Generated from 2000 to 2025 with specific Entry Dates and Exit Dates as per our defined conditions. along with Profits , Profit % etc. etc.

But the most vital statists are generated thru report. So this report basically shows
The Initial Capital of Rs. 1 lacks we started with
The Ending Capital as of today if we had followed the system
The Net Profit and its Percentage.
The Exposure of 12.03 %. Exposure Percentage tells you the percentage of times the system is actually invested. This basically means that if you were 100% invested a 100% of times then your exposure would be 100%. If you were 100% invested a 60% of times then your exposure would be 60%.
The compounded Annual Return from this trading system is 64.84%.
Risk Adjusted Return is 539.08% . This tells you the equivalent comp return would have been if your system would have been invested 100% of the times.

Statistics of Winners and Losers

Other Important statistics like
Maximum System drawdown of -5.68%. This means all through 25 years the system has gone down only by -5.68% from its peak high.
CAR/MaxDD of 11.42 - Compounded Annual Return divided by Max Drawdown.


This is just a simple example of how to back test your strategies and create a robust system.